Had a very odd issue with Windows 10 and taskbar menu items missing:
After lots of research, I’ve partially fixed this by running the following from an elevated command prompt:
for /R "%APPDATA%\Microsoft\Windows\Start Menu\Programs\" %f in (.lnk) do copy /b "%f"+,, "%f" 1>nul
for /R "%ALLUSERSPROFILE%\Microsoft\Windows\Start Menu\Programs\" %f in (.lnk) do copy /b "%f"+,, "%f" 1>nul
taskkill /IM explorer.exe /F
explorer.exe
What this does is:
Update “Last Update Date” attribute on Start Menu Links
Kill Explorer process
Start Explorer process
The result being:
The one missing icon is for Microsoft Edge (also other Microsoft Store Apps have missing icons too, such as Calculator etc).
After lots of research, investigation and trial-and-error, I solved the problem by uninstalling “Google Drive File Stream” (plus I dont really use this anyways):
The “Call Task” tool in Taskcentre is a useful tool in calling other tasks.
The task can run in two modes:
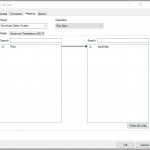
Synchronous
Queue
Queue
This adds the task to the queue, to be scheduled at a future point in time
Synchronous
This queues the task and awaits a response.
Sometimes in Taskcentre you wish to know if a task you have called has failed. This is useful in cases where there’s a queue of objects which require some work completing and you are processing these in a batch. Examples include:
Invoices to send
Sales Orders to process
Records require uploading to website
etc
The issue with calling tasks Synchronously is that you cannot easily tell if the task being run has failed or not, however by analysing the output of the task, you can record this information and make decisions accordingly.
The “TaskRunStatus” flag is the important part here. If the value is “2”, then the task completed successfully. Value “4” is a failure.
Using the “XML To RecordSet” tool, each results from the “Call Task” can be mapped to a Recordset:
From there, we can then use the “VBScript” tool to loop around all the RecordSet entries:
Here’s the VBScript:
If ThisStep.RecordSource("OutputData_TaskRunStatus") = 2 Then
Variables("SuccessCount") = Variables("SuccessCount") + 1
Else
Variables("FailCount") = Variables("FailCount") + 1
End If
From there, you can use these variables within your other steps. For example, here’s a HTML document which is posted to HipChat using code here.
Did you know that SQL Server provides several views which provide information on recommended indexes?
Using the following SQL, you can identify where SQL recommends indexes, ordered by potential performance boost from adding the suggested index.
Obviously you may wish to review these manually, rather than just blindly creating, but it gives you a pointer in the right direction!
It is also worth noting that this view is cleared when SQL Service is restarted, therefore it’s a good idea to restart the service, let the system run for a couple of hours or so, then grab the results and analyse further.
The code below works for all versions of SQL server after 2008, plus also Azure SQL Databases.
SELECT Â migs.avg_total_user_cost * (migs.avg_user_impact / 100.0) * (migs.user_seeks + migs.user_scans) AS improvement_measure
, 'CREATE INDEX [missing_index_' + CONVERT(VARCHAR, mig.index_group_handle) + '_' + CONVERT(VARCHAR, mid.index_handle)  + '_' + LEFT(PARSENAME(mid.statement, 1), 32) + ']'  + ' ON ' + mid.statement  + ' (' + ISNULL(mid.equality_columns, '')    + CASE
WHEN mid.equality_columns IS NOT NULL
AND mid.inequality_columns IS NOT NULL
THEN ','
ELSE ''
END Â Â Â + ISNULL(mid.inequality_columns, '') Â + ')' Â + ISNULL(' INCLUDE (' + mid.included_columns + ')', '') AS create_index_statement
, migs.*
,mid.database_id
,mid.[object_id]
FROM sys.dm_db_missing_index_groups mig
INNER JOIN sys.dm_db_missing_index_group_stats migs ON migs.group_handle = mig.index_group_handle
INNER JOIN sys.dm_db_missing_index_details mid ON mig.index_handle = mid.index_handle
WHERE migs.avg_total_user_cost * (migs.avg_user_impact / 100.0) * (migs.user_seeks + migs.user_scans) > 10
ORDER BY migs.avg_total_user_cost * migs.avg_user_impact * (migs.user_seeks + migs.user_scans) DESC
With the Azure SQL Database, sometimes you want to view the current running transactions. Unfortunately there is no GUI as such like there is with normal SQL Server (right click, “Activity Monitor”), however it can be grabbed by executing sys.dm_exec_requests.
The following SQL is very useful as it shows details of all running transactions within the database, including highlighting if the transaction is blocked, or is causing blocking.
SELECT r.session_id
,CASE
WHEN r.session_id IN (
SELECT DISTINCT (blocking_session_id)
FROM sys.dm_exec_requests
)
THEN 'Yes'
ELSE ''
END AS blocking
,r.blocking_session_id
,r.request_id
,r.start_time
,r.STATUS
,r.command
,r.database_id
,r.user_id
,r.wait_type
,r.wait_time
,r.last_wait_type
,r.wait_resource
,r.total_elapsed_time
,r.cpu_time
,CASE r.transaction_isolation_level
WHEN 0
THEN 'Unspecified'
WHEN 1
THEN 'ReadUncommitted'
WHEN 2
THEN 'ReadCommitted'
WHEN 3
THEN 'Repeatable'
WHEN 4
THEN 'Serializable'
WHEN 5
THEN 'Snapshot'
END AS transaction_isolation_level
,r.row_count
,r.percent_complete
,st.TEXT AS sql
FROM sys.dm_exec_requests r
CROSS APPLY sys.dm_exec_sql_text(r.sql_handle) AS st
GROUP BY r.session_id
,r.blocking_session_id
,r.request_id
,r.start_time
,r.STATUS
,r.command
,r.database_id
,r.user_id
,r.wait_type
,r.wait_time
,r.last_wait_type
,r.wait_resource
,r.total_elapsed_time
,r.cpu_time
,r.transaction_isolation_level
,r.row_count
,r.percent_complete
,st.TEXT
ORDER BY r.total_elapsed_time
Recently I’ve been doing some work on optimising indexes within Azure SQL Database. The following SQL from Daniel is very useful in showing the status of all the current indexes within a SQL Database. The SQL works for both SQL Server 2014 onwards, plus Azure SQL Database. I have not tested it on any other versions.
This code returns the following:
Object Type
Object Name
Index Name
Index Type
Partition (if any)
Compression
Data Space
Fill Factor
Rows
Reserved MB
In Row Used MB
Row Overflow Used MB
Out of Row Used MB
Total Used MB
SELECT --- Schema, type and name of object and index:
      REPLACE(obj.type_desc, '_', ' ') AS objectType
,      sch.[name] + '.' + obj.[name] AS objectName
,      ISNULL(ix.[name], '') AS indexName
,      ix.type_desc AS indexType
,      --- Partition number, if there are partitions:
      (CASE COUNT(*) OVER (
PARTITION BY ps.[object_id]
,ps.index_id
) Â Â Â Â Â Â Â Â Â Â Â Â
WHEN 1
THEN '' Â Â Â Â Â Â Â Â Â Â Â Â
ELSE CAST(ps.partition_number AS VARCHAR(10)) Â Â Â Â Â Â Â Â Â Â Â Â
END) AS [partition]
,      --- Storage properties:
      p.data_compression_desc AS [compression]
,      ds.[name] + ISNULL('(' + pc.[name] + ')', '') AS dataSpace
,      STR(ISNULL(NULLIF(ix.fill_factor, 0), 100), 4, 0) + '%' AS [fillFactor]
,      --- The raw numbers:
      ps.row_count AS [rows]
,      STR(1.0 * ps.reserved_page_count * 8 / 1024, 12, 2) AS reserved_MB
,      STR(1.0 * ps.in_row_used_page_count * 8 / 1024, 12, 2) AS inRowUsed_MB
,      STR(1.0 * ps.row_overflow_used_page_count * 8 / 1024, 12, 2) AS RowOverflowUsed_MB
,      STR(1.0 * ps.lob_used_page_count * 8 / 1024, 12, 2) AS outOfRowUsed_MB
,      STR(1.0 * ps.used_page_count * 8 / 1024, 12, 2) AS totalUsed_MB
FROM sys.dm_db_partition_stats AS ps
INNER JOIN sys.partitions AS p ON Â Â Â ps.[partition_id] = p.[partition_id]
INNER JOIN sys.objects AS obj ON Â Â Â ps.[object_id] = obj.[object_id]
INNER JOIN sys.schemas AS sch ON Â Â Â obj.[schema_id] = sch.[schema_id]
LEFT JOIN sys.indexes AS ix ON Â Â Â ps.[object_id] = ix.[object_id]
AND Â Â Â ps.index_id = ix.index_id
--- Data space is either a file group or a partition function:
LEFT JOIN sys.data_spaces AS ds ON Â Â Â ix.data_space_id = ds.data_space_id
--- This is the partitioning column:
LEFT JOIN sys.index_columns AS ixc ON Â Â Â ix.[object_id] = ixc.[object_id]
AND Â Â Â ix.index_id = ixc.index_id
AND Â Â Â ixc.partition_ordinal > 0
LEFT JOIN sys.columns AS pc ON Â Â Â pc.[object_id] = obj.[object_id]
AND Â Â Â pc.column_id = ixc.column_id
--- Not interested in system tables and internal tables:
WHERE obj.[type] NOT IN (
'S'
,'IT'
)
ORDER BY sch.[name]
,obj.[name]
,ix.index_id
,p.partition_number;
Following on from my blog post for running Microsoft Dynamics Nav as a different user here, I have done some further investigation of the runas command.
Typically the RunAs command is used for local authentication, however there is a little known switch which bypasses local authentication and uses it for network authentication only.
This switch allows you to run the Microsoft Dynamics NAV Client, Development Environment, or any other tools as a domain user, from a none domain user pc.
Recently I’ve had to delete duplicate records from the Record Link table in Microsoft Dynamics Nav.
Using the following SQL, (which uses the OVER clause for partitioning) this deletes all duplicate records, leaving the first unique item behind.
The SQL can be updated easily to function for other tables / scenarios. Currently it uses the following fields to identify duplicates:
Description
URL 1
The SQL does not look at the Notes, which is stored as a BLOB.
DELETE
FROM [Record Link]
WHERE [Link ID] IN (
SELECT [Link ID]
FROM (
SELECT *
,ROW_NUMBER() OVER (
PARTITION BY [Record ID]
,[Description]
,[URL1] ORDER BY [Link ID]
) AS [ItemNumber]
FROM [Record Link]
WHERE [Note] IS NULL
) a
WHERE ItemNumber > 1
)
Within SQL Server, sys.dm_db_missing_index_details returns indexes which it believes are required by the Query Optimiser. Basically as queries are run in the background, the Query Optimiser makes a record of any optimisations it feels are necessary. Restarting the SQL server resets all these stats.
Using some SQL it is possible to identify potentially missing indexes, create sample SQL to build these indexes. I’ve found the following SQL useful:
SELECT mid.statement
,migs.avg_total_user_cost * (migs.avg_user_impact / 100.0) * (migs.user_seeks + migs.user_scans) AS improvement_measure
,'CREATE INDEX [missing_index_' + CONVERT(VARCHAR, mig.index_group_handle) + '_' + CONVERT(VARCHAR, mid.index_handle) + '_' + LEFT(PARSENAME(mid.statement, 1), 32) + ']' + ' ON ' + mid.statement + ' (' + ISNULL(mid.equality_columns, '') + CASE
WHEN mid.equality_columns IS NOT NULL
AND mid.inequality_columns IS NOT NULL
THEN ','
ELSE ''
END + ISNULL(mid.inequality_columns, '') + ')' + ISNULL(' INCLUDE (' + mid.included_columns + ')', '') AS create_index_statement
,migs.*
,mid.database_id
,mid.[object_id]
FROM sys.dm_db_missing_index_groups mig
INNER JOIN sys.dm_db_missing_index_group_stats migs ON migs.group_handle = mig.index_group_handle
INNER JOIN sys.dm_db_missing_index_details mid ON mig.index_handle = mid.index_handle
WHERE migs.avg_total_user_cost * (migs.avg_user_impact / 100.0) * (migs.user_seeks + migs.user_scans) > 10
ORDER BY migs.avg_total_user_cost * migs.avg_user_impact * (migs.user_seeks + migs.user_scans) DESC
This produces results as follows:
Columns include:
statement – The table affected
improvement_measure – A generated measure of improvement (based on user cost, impact, seeks etc)
create_index_statement – A cut and paste friendly statement to add the index
group_handle – Identifies a group of missing indexes. This identifier is unique across the server.
unique_compiles – Number of compilations and recompilations that would benefit from this missing index group
user_seeks – Number of seeks caused by user queries that the recommended index in the group could have been used for
user_scans – Number of scans caused by user queries that the recommended index in the group could have been used for.
last_user_seek – Date and time of last seek caused by user queries that the recommended index in the group could have been used for.
last_user_scan – Date and time of last scan caused by user queries that the recommended index in the group could have been used for.
avg_total_user_cost – Average cost of the user queries that could be reduced by the index in the group.
avg_user_impact – Average percentage benefit that user queries could experience if this missing index group was implemented.
system_seeks – Number of seeks caused by system queries, such as auto stats queries, that the recommended index in the group could have been used for.
last_system_seek – Date and time of last system seek caused by system queries that the recommended index in the group could have been used for.
last_system_scan – Date and time of last system scan caused by system queries that the recommended index in the group could have been used for.
avg_total_system_cost – Average cost of the system queries that could be reduced by the index in the group.
avg_system_impact – Average percentage benefit that system queries could experience if this missing index group was implemented.
With Microsoft Dynamics Nav, there are various ways of viewing all the active sessions within the system. The easiest of which is the “Sessions” page within the software itself:
The downside of this, is that it only shows active sessions on the tier which the user is connected. This is ok for solutions where the system has a single tier, however it is common to have multiple tiers in order to spread load. Checking this way is time consuming as you need to check multiple tiers in order to get a session count.
However using SQL can be an easy way to get the number of active sessions:
It is worth nothing that Nav tidies up this table automatically, but in some cases it may be incorrect. For example if a middle tier crashes out, it could be left with orphaned records until the tier starts up again (or another tier prunes the records down).